ETFS Physical Precious Metals Basket Shares (GLTR
Gold
So far in 2018, pullbacks toward the support of the 50-day moving average or short-term trendlines have consistently provided traders with lucrative risk/reward scenarios, as shown by the chart of the SPDR gold Shares (GLD
). The recent pullback toward the support of the 200-day moving average could be viewed by many as a prime buying opportunity, and recent market volatility could be a catalyst that will drive prices higher over the short term. Active traders will watch for a bounce toward resistance and for a subsequent breakout, which would likely lead to target prices of $132 or more. (For more, see: 3 Charts That Suggest It’s Time to Buy Gold.)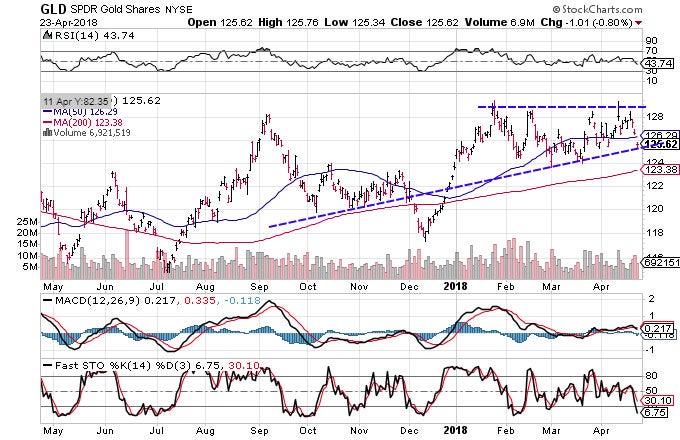
[Learn more about using moving averages to develop your trading strategy in Chapter 2 of the Technical Analysis course on the Investopedia Academy]
Silver
Silver prices traditionally lag gold or other precious metals such as platinum. However, the recent jump toward the dotted trendline on the chart of the iShares Silver Trust (SLV
) suggests that the story could be changing. Active traders are closely watching this chart because a break beyond the dotted trendline would be a technical sign of a trend reversal, and the bullish crossover between the MACD and its signal line suggests that this could be the attempt that they’ve been waiting for. The upcoming sessions will prove to be critical because several consecutive closes above will likely act as a catalyst for the other precious metals to head higher. (For more information, see: Now Is The Time To Buy Gold And Silver)
Bottom Line
Market volatility and cross-market sell-offs have many investors concerned that there are few good places to allocate their capital. While price metals have experienced sell-offs over the past few sessions, the pullbacks are creating lucrative risk-to-reward ratios that suggest the group of precious metals is one of the few segments to watch and could be poised for a significant move higher. (For more, see: 3 Positive Long-Term Charts for Precious Metals.)
Charts courtesy of StockCharts.com. At the time of writing, Casey Murphy did not own a position in any of the assets mentioned.
Read more: When in Doubt, Buy Precious Metals | Investopedia https://www.investopedia.com/news/when-doubt-buy-precious-metals/#ixzz5DcoLTS2M
Follow us: Investopedia on Facebook
 SHARE
SHARE

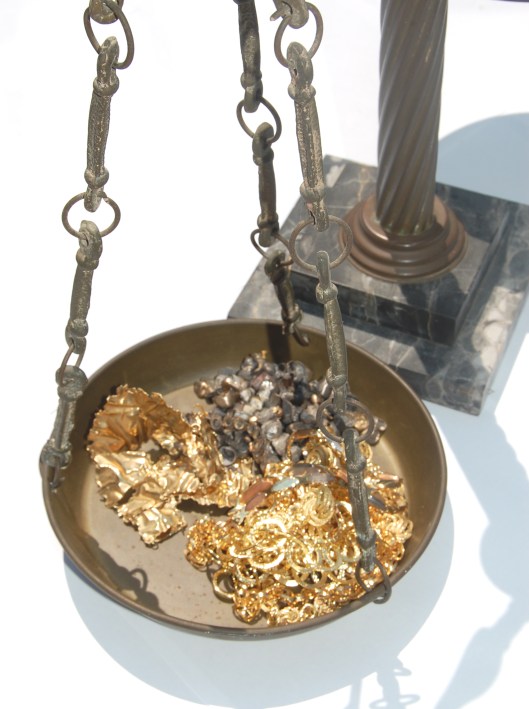
Heightened levels of market volatility in recent months have triggered a flood of uncertainty among fundamental investors and active traders alike. Globally, there is rising interest in hedging against sharp sell-offs, and many are turning to hard commodities such as precious metals. In this article, we take a look at several charts of interest and try to determine how followers of technical analysis will be positioning themselves over the weeks and months ahead. (For more, see: Traders Turn to Precious Metals Among Volatility.)
ETFS Physical Precious Metals Basket Shares (GLTR
)
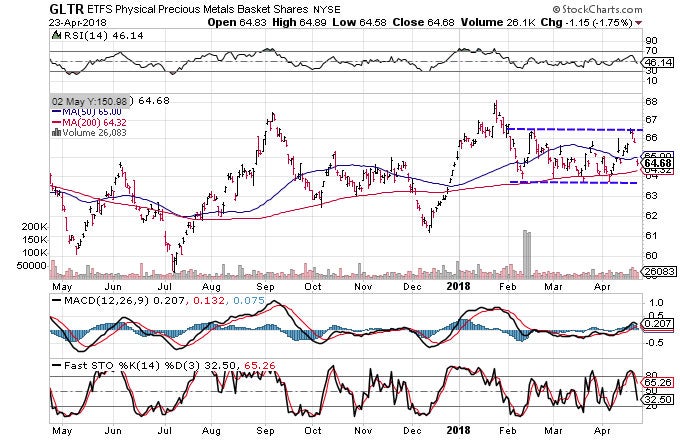
The recent market-wide pullbacks have led some traders to believe that the selling pressure in some of the precious metals will continue well into the summer. By taking a look at the chart of the ETFS Physical Precious Metals Basket Shares, you can see that the price seems to have reacted to a nearby level of resistance and has started to retrace toward the major support of its 200-day moving average (red line). This is common behavior and shouldn’t really come as a surprise to experienced traders. In fact, traders may want to look at the retracement as a buying opportunity because a bounce higher, followed by a break beyond the upper resistance, could force some to readjust their targets to $69.50, which is equal to the upper resistance plus the height of the pattern. The well-defined risk-to-reward ratios make this a segment to watch, and we’ll take a closer look at the a few components to see exactly how traders are trading the move. (For more, see: Precious Metals Pullback Suggests It Is Time to Buy.)
Gold
So far in 2018, pullbacks toward the support of the 50-day moving average or short-term trendlines have consistently provided traders with lucrative risk/reward scenarios, as shown by the chart of the SPDR gold Shares (GLD
). The recent pullback toward the support of the 200-day moving average could be viewed by many as a prime buying opportunity, and recent market volatility could be a catalyst that will drive prices higher over the short term. Active traders will watch for a bounce toward resistance and for a subsequent breakout, which would likely lead to target prices of $132 or more. (For more, see: 3 Charts That Suggest It’s Time to Buy Gold.)
[Learn more about using moving averages to develop your trading strategy in Chapter 2 of the Technical Analysis course on the Investopedia Academy]
Silver
Silver prices traditionally lag gold or other precious metals such as platinum. However, the recent jump toward the dotted trendline on the chart of the iShares Silver Trust (SLV
) suggests that the story could be changing. Active traders are closely watching this chart because a break beyond the dotted trendline would be a technical sign of a trend reversal, and the bullish crossover between the MACD and its signal line suggests that this could be the attempt that they’ve been waiting for. The upcoming sessions will prove to be critical because several consecutive closes above will likely act as a catalyst for the other precious metals to head higher. (For more information, see: Now Is The Time To Buy Gold And Silver)
Bottom Line
Market volatility and cross-market sell-offs have many investors concerned that there are few good places to allocate their capital. While price metals have experienced sell-offs over the past few sessions, the pullbacks are creating lucrative risk-to-reward ratios that suggest the group of precious metals is one of the few segments to watch and could be poised for a significant move higher. (For more, see: 3 Positive Long-Term Charts for Precious Metals.)
Charts courtesy of StockCharts.com. At the time of writing, Casey Murphy did not own a position in any of the assets mentioned.
Read more: When in Doubt, Buy Precious Metals | Investopedia https://www.investopedia.com/news/when-doubt-buy-precious-metals/#ixzz5DcoLTS2M
Follow us: Investopedia on Facebook
Heightened levels of market volatility in recent months have triggered a flood of uncertainty among fundamental investors and active traders alike. Globally, there is rising interest in hedging against sharp sell-offs, and many are turning to hard commodities such as precious metals. In this article, we take a look at several charts of interest and try to determine how followers of technical analysis will be positioning themselves over the weeks and months ahead. (For more, see: Traders Turn to Precious Metals Among Volatility.)
ETFS Physical Precious Metals Basket Shares (GLTR
)
The recent market-wide pullbacks have led some traders to believe that the selling pressure in some of the precious metals will continue well into the summer. By taking a look at the chart of the ETFS Physical Precious Metals Basket Shares, you can see that the price seems to have reacted to a nearby level of resistance and has started to retrace toward the major support of its 200-day moving average (red line). This is common behavior and shouldn’t really come as a surprise to experienced traders. In fact, traders may want to look at the retracement as a buying opportunity because a bounce higher, followed by a break beyond the upper resistance, could force some to readjust their targets to $69.50, which is equal to the upper resistance plus the height of the pattern. The well-defined risk-to-reward ratios make this a segment to watch, and we’ll take a closer look at the a few components to see exactly how traders are trading the move. (For more, see: Precious Metals Pullback Suggests It Is Time to Buy.)
Gold
So far in 2018, pullbacks toward the support of the 50-day moving average or short-term trendlines have consistently provided traders with lucrative risk/reward scenarios, as shown by the chart of the SPDR gold Shares (GLD
). The recent pullback toward the support of the 200-day moving average could be viewed by many as a prime buying opportunity, and recent market volatility could be a catalyst that will drive prices higher over the short term. Active traders will watch for a bounce toward resistance and for a subsequent breakout, which would likely lead to target prices of $132 or more. (For more, see: 3 Charts That Suggest It’s Time to Buy Gold.)
[Learn more about using moving averages to develop your trading strategy in Chapter 2 of the Technical Analysis course on the Investopedia Academy]
Silver
Silver prices traditionally lag gold or other precious metals such as platinum. However, the recent jump toward the dotted trendline on the chart of the iShares Silver Trust (SLV
) suggests that the story could be changing. Active traders are closely watching this chart because a break beyond the dotted trendline would be a technical sign of a trend reversal, and the bullish crossover between the MACD and its signal line suggests that this could be the attempt that they’ve been waiting for. The upcoming sessions will prove to be critical because several consecutive closes above will likely act as a catalyst for the other precious metals to head higher. (For more information, see: Now Is The Time To Buy Gold And Silver)
Bottom Line
Market volatility and cross-market sell-offs have many investors concerned that there are few good places to allocate their capital. While price metals have experienced sell-offs over the past few sessions, the pullbacks are creating lucrative risk-to-reward ratios that suggest the group of precious metals is one of the few segments to watch and could be poised for a significant move higher. (For more, see: 3 Positive Long-Term Charts for Precious Metals.)
Charts courtesy of StockCharts.com. At the time of writing, Casey Murphy did not own a position in any of the assets mentioned.
Read more: When in Doubt, Buy Precious Metals | Investopedia https://www.investopedia.com/news/when-doubt-buy-precious-metals/#ixzz5DcoLTS2M
Follow us: Investopedia on Facebook