• About
  • Daily Market Update

Landis Refining Industry News

~ Keeping up with all things Dental and Metal

Landis Refining Industry News

Category Archives: scrap gold

Are The Precious Metals Percolating For A Big Move? | Seeking Alpha

08 Tuesday May 2018

Posted by landisrefining in gold, market, precious metal market, scrap gold, scrap precious metals

≈ Leave a comment

Tags

gold market, gold prices, trading gold

Since the beginning of 2018, gold has been stuck in a trading range between $1310 and $1360. Silver has ranged between $16.20 and $17.50, though primarily between $16.80 and $16.25 since February. So what’s next? While most analysts base their views largely on chart technicals, I have found – at least for me – the Commitments of Traders “tea

landis refining, dental industry, scrap metal, purchase gold, purchase dental scraps, gold market

Ticker

 leaves” is a more reliable forecasting tool. Friday’s COT report showed a continuation of the trader positioning pattern that I believe will support the next big move higher.

Elijah Johnson and James Anderson invited me on to their weekly Metals and Markets podcast to discuss why I believe the metals may be bottoming. In addition, we discuss the why Amazon.com (NASDAQ:AMZN) and Tesla (NASDAQ:TSLA) are horrifically overvalued:

via Are The Precious Metals Percolating For A Big Move? | Seeking Alpha

Visit us at LandisRefining.com

PRECIOUS-Gold prices crawl up as dollar pauses rally | Reuters

07 Monday May 2018

Posted by landisrefining in gold, market, precious metal market, scrap gold, scrap precious metals

≈ Leave a comment

Tags

gold market, gold price, landis refining, landis refining blog, scrap precious metal

landis refining, dental industry, scrap metal, purchase gold, purchase dental scraps

American Gold Coin

BENGALURU, May 7 (Reuters) – Gold prices edged up in early
trade on Monday as the dollar took a breather after climbing to
its highest level this year in the previous session.

FUNDAMENTALS
* Spot gold rose 0.2 percent to $1,316.62 per ounce
at 0034 GMT.
* U.S. gold futures for June delivery were up 0.2
percent at $1,317.20 per ounce.
* The dollar index , which measures the greenback
against a basket of six major currencies, was steady at 92.547
after hitting its best since December at 92.900 on Friday.

* U.S. job growth increased less than expected in April and
the unemployment rate dropped to near a 17-1/2-year low of 3.9
percent as some out-of-work Americans left the labor force.
* Two Federal Reserve officials who are currently voting
members of the U.S. central bank’s rate-setting committee said
on Friday they were keeping an open mind on the total number of
interest rate rises needed this year.
* U.S. interest rate futures rose modestly on Friday, as
traders still expect the Federal Reserve to raise key borrowing
costs at its June 12-13 policy meeting in the wake of
weaker-than-forecast growth in domestic payrolls and wages in
April.
* Euro zone business growth dimmed again in April but the
picture remained relatively bright as new business stayed
buoyant and firms managed to build up backlogs of work, a survey
showed on Friday.
* SPDR Gold Trust , the world’s largest gold-backed
exchange-traded fund, said its holdings fell 0.17 percent to
864.13 tonnes on Friday from 865.60 tonnes on Thursday.

* Hedge funds and money managers trimmed their net long
positions in COMEX gold contracts in the week to May 1, U.S.
Commodity Futures Trading Commission (CFTC) data showed on
Friday.
* Demand for physical gold barely changed in major Asian
hubs last week even as global prices weakened, while a
correction in local rates in India prompted retail consumers and
jewellers to start purchases.
* The World Gold Council, owner of the world’s largest
gold-backed exchange traded fund (ETF), is launching a new fund
with a cut-price management fee to fend off rivals with lower
charges, a source familiar with the matter told Reuters.

via PRECIOUS-Gold prices crawl up as dollar pauses rally | Reuters

Visit us at LandisRefining.com

CFTC Fines Two UAE Traders $2.7 Million Over Precious Metals Spoofing | Finance Magnates

04 Friday May 2018

Posted by landisrefining in market, precious metal market, scrap gold

≈ Leave a comment

crying-sad-trader-or-broker

Photo: Reuters

The US Commodity Futures

Trading Commission (CFTC) has fined two gold futures traders from the UAE over allegations that they schemed to manipulate the precious metals futures market through a trading tactic known as ‘spoofing’.

Heet Khara and Nasim Salim, both are former traders of CME Group’s gold and silver futures contracts, were hit by $2.7 million in penalties for engaging in disruptive trading practices by placing bids and offers with the intent to cancel them before execution. The abuses of United Arab Emirates residents allegedly occurred between February 2015 through at least April 28, 2015.

Spoofing, in general, is a practice in which a trader floods the market with fake orders by entering and quickly canceling large buy or sell orders on an exchange, in order to fool other traders into thinking that the market is poised to rise or fall.

Read more via CFTC Fines Two UAE Traders $2.7 Million Over Precious Metals Spoofing | Finance Magnates

Visit us at LandisRefining.com

One of the Rarest Precious Metals Hits a Record High – Bloomberg

27 Friday Apr 2018

Posted by landisrefining in gold, market, precious metal market, scrap gold, scrap precious metals

≈ Leave a comment

Iridium

photo courtesy of periodictable.com

One of the least known precious metals hit a record on healthy demand from the car industry and for growing crystals used in mobile phones.

 Iridium, one of the platinum-group metals, has climbed 12 percent this year, outperforming everything from nickel to gold. As the second-densest element and with one of the highest melting points among metals, it’s sought after for its use in spark plugs and glass manufacturing.


Read more via One of the Rarest Precious Metals Hits a Record High – Bloomberg

Follow us on instagram

Like us on facebook

Visit us at LandisRefining.com

When in Doubt, Buy Precious Metals | Investopedia

24 Tuesday Apr 2018

Posted by landisrefining in scrap gold

≈ Leave a comment

When in Doubt, Buy Precious Metals

By Casey Murphy | April 24, 2018 — 8:33 AM EDT

Heightened levels of market volatility in recent months have triggered a flood of uncertainty among fundamental investors and active traders alike. Globally, there is rising interest in hedging against sharp sell-offs, and many are turning to hard commodities such as precious metals. In this article, we take a look at several charts of interest and try to determine how followers of technical analysis will be positioning themselves over the weeks and months ahead. (For more, see: Traders Turn to Precious Metals Among Volatility.)

ETFS Physical Precious Metals Basket Shares (GLTR

The recent market-wide pullbacks have led some traders to believe that the selling pressure in some of the precious metals will continue well into the summer. By taking a look at the chart of the ETFS Physical Precious Metals Basket Shares, you can see that the price seems to have reacted to a nearby level of resistance and has started to retrace toward the major support of its 200-day moving average (red line). This is common behavior and shouldn’t really come as a surprise to experienced traders. In fact, traders may want to look at the retracement as a buying opportunity because a bounce higher, followed by a break beyond the upper resistance, could force some to readjust their targets to $69.50, which is equal to the upper resistance plus the height of the pattern. The well-defined risk-to-reward ratios make this a segment to watch, and we’ll take a closer look at the a few components to see exactly how traders are trading the move. (For more, see: Precious Metals Pullback Suggests It Is Time to Buy.)

Technical chart showing the performance of the ETFS Physical Precious Metals Basket Shares (GLTR)

Gold

So far in 2018, pullbacks toward the support of the 50-day moving average or short-term trendlines have consistently provided traders with lucrative risk/reward scenarios, as shown by the chart of the SPDR gold Shares (GLD

GLD
SPDR Gold Trust
126.23
+0.49%


). The recent pullback toward the support of the 200-day moving average could be viewed by many as a prime buying opportunity, and recent market volatility could be a catalyst that will drive prices higher over the short term. Active traders will watch for a bounce toward resistance and for a subsequent breakout, which would likely lead to target prices of $132 or more. (For more, see: 3 Charts That Suggest It’s Time to Buy Gold.)Technical chart showing the performance of the SPDR gold Shares (GLD)

[Learn more about using moving averages to develop your trading strategy in Chapter 2 of the Technical Analysis course on the Investopedia Academy]

Silver

Silver prices traditionally lag gold or other precious metals such as platinum. However, the recent jump toward the dotted trendline on the chart of the iShares Silver Trust (SLV

SLV
iShs Silver Tr
15.76
+0.57%


) suggests that the story could be changing. Active traders are closely watching this chart because a break beyond the dotted trendline would be a technical sign of a trend reversal, and the bullish crossover between the MACD and its signal line suggests that this could be the attempt that they’ve been waiting for. The upcoming sessions will prove to be critical because several consecutive closes above will likely act as a catalyst for the other precious metals to head higher. (For more information, see: Now Is The Time To Buy Gold And Silver)Technical chart showing the performance of the iShares Silver Trust (SLV)

Bottom Line

Market volatility and cross-market sell-offs have many investors concerned that there are few good places to allocate their capital. While price metals have experienced sell-offs over the past few sessions, the pullbacks are creating lucrative risk-to-reward ratios that suggest the group of precious metals is one of the few segments to watch and could be poised for a significant move higher. (For more, see: 3 Positive Long-Term Charts for Precious Metals.)

Charts courtesy of StockCharts.com. At the time of writing, Casey Murphy did not own a position in any of the assets mentioned.

Read more: When in Doubt, Buy Precious Metals | Investopedia https://www.investopedia.com/news/when-doubt-buy-precious-metals/#ixzz5DcoLTS2M
Follow us: Investopedia on Facebook

When in Doubt, Buy Precious Metals

By Casey Murphy | April 24, 2018 — 8:33 AM EDT

 SHARE


ADD TO WATCHLIST

GLTR
ETFS Prcus Mtls Trust Units
64.97
+0.44%
GLD
SPDR Gold Trust
126.23
+0.49%
SLV
iShs Silver Tr
15.76
+0.57%

View Watchlist

Heightened levels of market volatility in recent months have triggered a flood of uncertainty among fundamental investors and active traders alike. Globally, there is rising interest in hedging against sharp sell-offs, and many are turning to hard commodities such as precious metals. In this article, we take a look at several charts of interest and try to determine how followers of technical analysis will be positioning themselves over the weeks and months ahead. (For more, see: Traders Turn to Precious Metals Among Volatility.)

ETFS Physical Precious Metals Basket Shares (GLTR

GLTR
ETFS Prcus Mtls Trust Units
64.97
+0.44%

)

The recent market-wide pullbacks have led some traders to believe that the selling pressure in some of the precious metals will continue well into the summer. By taking a look at the chart of the ETFS Physical Precious Metals Basket Shares, you can see that the price seems to have reacted to a nearby level of resistance and has started to retrace toward the major support of its 200-day moving average (red line). This is common behavior and shouldn’t really come as a surprise to experienced traders. In fact, traders may want to look at the retracement as a buying opportunity because a bounce higher, followed by a break beyond the upper resistance, could force some to readjust their targets to $69.50, which is equal to the upper resistance plus the height of the pattern. The well-defined risk-to-reward ratios make this a segment to watch, and we’ll take a closer look at the a few components to see exactly how traders are trading the move. (For more, see: Precious Metals Pullback Suggests It Is Time to Buy.)

Technical chart showing the performance of the ETFS Physical Precious Metals Basket Shares (GLTR)

Gold

So far in 2018, pullbacks toward the support of the 50-day moving average or short-term trendlines have consistently provided traders with lucrative risk/reward scenarios, as shown by the chart of the SPDR gold Shares (GLD

GLD
SPDR Gold Trust
126.23
+0.49%


). The recent pullback toward the support of the 200-day moving average could be viewed by many as a prime buying opportunity, and recent market volatility could be a catalyst that will drive prices higher over the short term. Active traders will watch for a bounce toward resistance and for a subsequent breakout, which would likely lead to target prices of $132 or more. (For more, see: 3 Charts That Suggest It’s Time to Buy Gold.)Technical chart showing the performance of the SPDR gold Shares (GLD)

[Learn more about using moving averages to develop your trading strategy in Chapter 2 of the Technical Analysis course on the Investopedia Academy]

Silver

Silver prices traditionally lag gold or other precious metals such as platinum. However, the recent jump toward the dotted trendline on the chart of the iShares Silver Trust (SLV

SLV
iShs Silver Tr
15.76
+0.57%


) suggests that the story could be changing. Active traders are closely watching this chart because a break beyond the dotted trendline would be a technical sign of a trend reversal, and the bullish crossover between the MACD and its signal line suggests that this could be the attempt that they’ve been waiting for. The upcoming sessions will prove to be critical because several consecutive closes above will likely act as a catalyst for the other precious metals to head higher. (For more information, see: Now Is The Time To Buy Gold And Silver)Technical chart showing the performance of the iShares Silver Trust (SLV)

Bottom Line

Market volatility and cross-market sell-offs have many investors concerned that there are few good places to allocate their capital. While price metals have experienced sell-offs over the past few sessions, the pullbacks are creating lucrative risk-to-reward ratios that suggest the group of precious metals is one of the few segments to watch and could be poised for a significant move higher. (For more, see: 3 Positive Long-Term Charts for Precious Metals.)

Charts courtesy of StockCharts.com. At the time of writing, Casey Murphy did not own a position in any of the assets mentioned.

Read more: When in Doubt, Buy Precious Metals | Investopedia https://www.investopedia.com/news/when-doubt-buy-precious-metals/#ixzz5DcoLTS2M
Follow us: Investopedia on Facebook

via When in Doubt, Buy Precious Metals | Investopedia

Your smartphone is a mine of precious metals and elements

20 Friday Apr 2018

Posted by landisrefining in market, precious metal market, scrap gold

≈ Leave a comment

Tags

elements, precious metal, scrap precious metals, smart phone

smartphones-galaxy-great-black

photo courtesy of samsung.com

Take a good look at your smartphone. From the display and metal casing to the circuit boards that power the device, your phone is a mine of precious metals.

The average smartphone contains small amounts of gold, silver, platinum and palladium. But mining these metals from ore can be arduous; it takes a tonne of ore to get 1g of gold. Stripping them from existing mobile phones is not easy but can yield a surprising amount of material.

Copper and aluminium, typically lower value than precious metals, can also be found in your smartphone, in the casing or the circuit board.

There is more than just precious metals in your smartphone. Rare earth elements can be found in everything from the glass display to magnets in speakers. Despite the name, rare earth elements aren’t actually that scarce; they can be found in the earth’s crust but are difficult to mine. Such elements can include yttrium and gadolinium in the display; neodymium which is often used in headphones or speakers and microphones; lanthanum to make the tiny lens in the camera that much better; and praseodymium, also for headphones.

Lithium triangle

Then you have to look at the battery that powers it. Smartphones predominantly have lithium ion batteries, which require lithium. Extracted from salt lakes, much of it comes from the so-called “lithium triangle” that includes Bolivia, Chile and Argentina.

Cobalt is also used in smartphone batteries. Around half the world’s cobalt comes from the Democratic Republic of Congo in central Africa. It’s essential for lithium-ion batteries, but there are ethical considerations. There is a link between cobalt mining and child labour, and the region is plagued by corruption and conflict.

A considerable amount of the cobalt – about one fifth – in the region is extracted by artisanal miners, who work by hand. The work is hazardous and can have health implications, from lung conditions and breathing issues caused by the dust to a link to premature births and birth defects in miners’ families.

Read more via Your smartphone is a mine of precious metals and elements

Visit us at LandisRefining.com

Gold, Silver Slightly Lower Amid Upbeat Risk Appetite | Kitco News

10 Tuesday Apr 2018

Posted by landisrefining in dental scrap, gold, market, precious metal market, scrap gold, scrap precious metals

≈ Leave a comment

Tags

gold market, kitco, metal market, scrap precious metal, silver market

stock market

Photo courtesy of colourbox.com

(Kitco News) – Safe-haven gold and silver prices are slightly lower in early U.S. trading Monday. Higher world stock markets overnight are a negative for the competing asset class of precious metals. However, a slightly weaker U.S. dollar index today is working in favor of the metals bulls. June Comex gold futures were last down $0.60 an ounce at $1,335.40. May Comex silver was last down $0.007 at $16.355 an ounce.

U.S. stock indexes are also pointed toward higher openings when the New York day session begins, which suggests better investor risk appetite in the marketplace to start the trading week. Still, traders and investors are wondering if the high volatility in the stock market will continue this week. Such would favor the stock market bears and the precious metals market bulls.

The markets have not reacted significantly to reports of missile strikes on the Syrian military overnight, after weekend reports that the Syrian army has used poison gas on its civilians. Reports said the missile strikes came from Israeli jets.

The U.S.-China trade dispute simmered down a bit during the weekend. Trump administration officials said on Sunday that trade sanctions against China are not imminent and there is time to work out a solution to the matter.

The key “outside markets” on Monday morning see the U.S. dollar index slightly lower. The greenback is seeing a corrective pullback today after hitting a five-week high on Friday. Meantime, Nymex crude oil prices are higher and trading just below $63.00 a barrel.

Read more via Gold, Silver Slightly Lower Amid Upbeat Risk Appetite | Kitco News

Visit us at LandisRefining.com

Exclusive-Five Banks Open Up Trillion Dollar Gold Club – The New York Times

07 Wednesday Mar 2018

Posted by landisrefining in scrap gold

≈ Leave a comment

100281353-gold_bars_piles_gettyP.530x298LONDON — The five banks that settle every transaction in London’s $6.8 trillion (4.9 trillion pounds) a year gold market are changing the rules of their clearing house to make it easier for newcomers to join.

The reform is part of a broad overhaul of institutions that underpin the world’s largest bullion trading centre to make them more transparent after accusations of price manipulation by banks and traders and pressure from regulators.

As that pressure increased, the number of banks clearing gold transactions through a company they own called the London Precious Metals Clearing Limited (LPMCL) has dwindled from seven to five. They are HSBC, JPMorgan, Scotiabank, UBS, and ICBC Standard.

Several banks have attempted to join the group in recent years. ICBC Standard joined in 2016 after months of wrangling over conditions and an application from at least one other, Goldman Sachs, was declined, sources in LPMCL member banks said.

Spokespeople for HSBC, JPMorgan, Scotiabank, UBS and ICBC Standard declined to comment. A spokesman for Goldman Sachs declined to comment on whether its application had been turned down.

Read more via Exclusive-Five Banks Open Up Trillion Dollar Gold Club – The New York Times

Follow us on Instagram

Like us on Facebook

Protect Your Patients and Practice from Prions, Viruses, and Systemic Disease | Dentistry Today

07 Wednesday Mar 2018

Posted by landisrefining in scrap gold

≈ Leave a comment

Viruses are an extremely important component of periodontal disease, both in its initiation and in the ongoing promotion of the attack process. Viruses that initially stem from the mouth also may have much wider systemic impacts.

Several years ago, Jorgen Slots, DDS, PhD, a professor of dentistry at the University of Southern California, reported that herpesviruses [both Epstein-Barr virus type 1 (EBV-1) and human cytomegalovirus (HCMV)] are some of the unrecognized major viruses implicated1 in periodontal attack. Unfortunately, when one transitions from the study of bacteria to consideration of viruses, most dentists cringe, since the profession has the least training in comprehending that submicroscopic world.

Herpesviruses are a leading cause of human viral diseases. There are 9 herpesvirus types known to infect humans: herpes simplex viruses (HSV-1 and HSV-2), varicella-zoster virus (chicken pox and shingles), Epstein-Barr virus (EBV or HHV-4), human cytomegalovirus (HCMV or HHV-5), human herpesvirus (HHV-6A, HHV-6B, and HHV-7), and Kaposi’s sarcoma-associated herpesvirus (KSHV)2.

Ruth F. Itzhaki, PhD, MSc, MA3, demonstrated that the herpes simplex virus type 1 (HSV1), the same virus that causes cold sores in the mouth, is present in the elderly human brain. Once HSV1 infects the epithelial cells of the mucous membranes of the face, it secondarily infects sensory nerve terminals. After it enters the neuron, HSV1 moves to the neuronal cell body in the trigeminal ganglion, located at the base of the skull adjacent to the brain stem.

HSV1 remains in the ganglion in a latent form until reactivation, when the newly synthesized virus is retrograde transported more peripherally4, eventually leading to visible outbreaks such as on the lip. In older subjects, this highly prevalent virus reactivates and enters the brain by way of the peripheral nervous system or the olfactory route5. Though it becomes latent in the brain, it periodically reactivates in association with stressors such as systemic infection and immunosuppression.

Spirochetes, HSV1, Beta Amyloid, and Systemic Diseases

Pathogen-induced inflammation and central nervous system accumulation of beta amyloid (Aβ) (Figure 1) damages the blood-brain barrier, which contributes to the pathophysiology of Alzheimer’s disease (AD)6. Data for both Chlamydophila pneumoniae and spirochetes7,8 shows a high prevalence of these pathogens in AD brains only, suggesting that secondary C pneumoniae and/or spirochete infection of the brain may occur after preliminary HSV1 and other co-factors have already initiated AD pathogenesis9.

Figure 2. Amyloid plaques are the hallmark of Alzheimer’s disease. Figure 3. The icosahedral capsid in the herpes simplex virus resembles the bacteriophage capsid.

Since spirochetes can invade all tissues of the body via circulatory pathways10, they may be the instigators of the inflammation that damages the lining of blood vessels and possibly deteriorates the blood brain barrier11. Spirochetes also can take the trigeminal nerve pathway to the brain. Thus, the activation of the already present latent HSV1 by spirochetes in the brain could represent the final step in a series of infections leading to full blown Alzheimer’s disease.

Amyloid plaques, the hallmark of AD, contain fibrillar Aβ (Figure 2). HSV1 has been implicated as a risk factor for AD and found to co-localize within Aβ plaques. Aβ peptides represent anti-infective peptides that protect against neurotropic virus infections such as HSV1 (Figure 3). The Aβ peptide may protect against latent herpes viruses and other infections. This antimicrobial property may explain why Aβ plaque formation plays a pathogenic role in the progression of the sporadic form of AD because it is reacting to an infection12,13.

Very recent research has shown that Aβ plaque in AD is an active biofilm of viable Borrelia spirochetes in Alzheimer’s disease patients. Alan MacDonald, MD, presented compelling evidence from brain tissue harvested from deceased Alzheimer’s patients. In his 37-minute video14, Borrelia Chronic Brain Infections and Development of Alzheimer’s Disease, MacDonald used specific DNA marker probes to ascertain the presence of Borrelia burgdorferi spirochetes (implicated in Lyme disease).

Figure 4. There are key differences between a normal prion and the variant folded-over pathogenic form. Figure 5. The icosahedral capsid in the bacteriophage resembles the herpes virus capsid.

According to MacDonald, 100% of the samples tested demonstrated that active biofilms of various forms of Borrelia were enveloped within Aβ. For the first time, MacDonald demonstrated the spore-like role of granular forms of borrelia as viable, virulent pathogens, distinct from the easily recognized spiral corkscrew shaped forms. He identified round body forms of spirochetes in the evolution of AD. All these forms live within active biofilm communities previously characterized as undefined, dead, brown-appearing lesions called Aβ plaques.

Alzheimer’s, Diabetes, and CJD

Growing evidence is showing that diabetes and AD are concurrent entities. Plaques containing fibrillar Aβ deposits associated with dying cells and inflammatory processes are hallmark pathological features in AD and diabetes15,16. The accumulation of Aβ within islet β-cells is a major pathological feature of the pancreas in patients with chronic diabetes.

Figure 6. Bacteriophages inject virus particles into spirochetes.

Viruses also may be involved Creutzfeldt–Jakob disease (CJD) despite its earlier connection with prion accumulation. CJD is more commonly known as the human form of “mad cow disease” [bovine spongiform encephalopathy (BSE)]. This devastating degenerative neurological disorder is untreatable and inevitably fatal.

CJD is characterized by the presence of a deformed protein called a prion. There is controversy as to how the disease progresses. The explanation most commonly accepted is that a defective prion replicates by converting its properly folded counterparts in the host to the same misfolded structure it possesses, or “prion only theory”17.

However, Laura Manuelidis, MD,18 proposed that virus particles cause CJD.19 Manuelidis claimed that although much work remains to be done, there is a reasonable explanation that viral particles cause the transformation of the prion that is the hallmark of CJD.

It is likely that all the various versions of an abnormal prion are the result of infection by an exogenous and stable viral particle and are a consequence of the neurodegenerative disease process rather than its cause. Abnormal prions are present in extremely small amounts in accessible tissues or body fluids such as blood, urine, saliva, and cerebrospinal fluid20,21.

CJD causes tissue to degenerate rapidly. As the disease destroys the brain, holes in the neural structures develop that resemble a sponge in appearance. Viruses incorporating their DNA elements into the host DNA can reprogram the prion protein synthesis mechanism to produce “mutant” prions.

Prion disease epidemics, which have demonstrated unpredictable recurrence, are of significant concern for animal and human health. Furthermore, chronic wasting disease (CWD) is a relatively new and burgeoning prion epidemic in deer, elk, and moose (members of the cervid family) and may be related to the human prion versions22,23.

This perspective on possible links between CJD and viral pathogens causes us to question if other neurologic diseases causing similar brain damage also may by caused by viruses. AD, multiple sclerosis, autism, Parkinson’s disease, amyotrophic lateral sclerosis, and other neurological entities display similar brain damage.

AD24 is the most common of many neurodegenerative disorders primarily affecting aging humans. Frank Dohler and his colleagues25 reported an investigation that showed an amyloid’s abnormal ability to attract and bind to prions, the same type of molecules that become erratic in BSE and CJD. A normal amyloid is a stacking of normal prions26 (Figure 4).

The main problem in AD is that Aβ formation becomes so prevalent that this material interferes with normal electrical connections in the brain11. Aβ are peptides of 36 to 43 amino acids that are fatefully involved in AD as the main component of the Aβ plaques11.

These peptides result from an amyloid precursor protein (APP) that is altered by certain enzymes to yield Aβ. These molecules can accumulate to form flexible, soluble Aβ fibrils. Abnormal Aβ is a variant binding of a deformed amyloid with folded-over prions, the same malformed, problematic process that exists in BSE and CJD.

It is now believed that certain misfolded abnormal oligomers known as seeds can induce other amyloid molecules to also take on an aberrant, misfolded oligomeric form, leading to a chain reaction akin to an abnormal prion infection.27 The seeds, or the resulting Aβ plaques, interfere with function and are toxic to nerve cells. The other protein implicated in AD, tau protein, also forms prion-like misfolded oligomers, and there is some evidence that misfolded Aβ can induce tau to misfold 32, 28.

In BSE and CJD, as discussed earlier, there is a growing consensus that a virus is encoding prions that are misfolded. If this hypothesis proves to be true, then what is the possibility that the final step of the AD process is also caused by the same virus?

Spirochetes and Viruses

Spirochetes are associated with bacterial viruses called bacteriophages (Figure 5), which are normally lethal to bacteria. Eukaryotic dsDNA viruses (those viruses that replicate only inside the living cells) evolved from bacteriophages. The herpesviruses discussed earlier also evolved from a bacteriophage, but from a different evolutionary root.

Papillomaviruses evolved from single-stranded DNA viruses and ultimately from plastids29. When phages attach to and inject their DNA contents into spirochetes, the cells react differently from other bacteria and are not lysed by the bacteriophage30.

Instead, researchers realized that they could use these bacteria viruses as research tools31 to alter spirochetal DNA. Bacteriophages were used to inject virus DNA into spirochetes to increase their virulence, such as antibiotic resistance. The Borrelia burgdorferi spirochete is an alleged example of this potentially weaponizing alteration32. Bacteriophages have also been isolated in dental plaque33.

Spirochetes contain plastids, which are small linear or circular extra-chromosomal DNA. These packages can be transferred between other species’ spirochetes and to other bacteria as well in a process called transduction. Since bacteriophages and plastids are intimately associated with spirochetes (Figure 6), it would not be much of a stretch to speculate that the herpesviruses are also associated with spirochetes since all three are so closely related to each other in their evolutionary tree.

Spirochetes can transport these viruses by disseminating them to distant organs, further substantiating their potential importance in oral and linked systemic disease. Thus, it is possible that spirochetes serve as a rich source of transferable genetic material to remote locations of the body. Since many spirochetal diseases produce neurological symptoms34, such as syphilis and Lyme disease, further research is needed to evaluate whether herpesviruses or viral particles carried by spirochetes to the brain are associated with alteration of prions and Aβ.

Read more via Protect Your Patients and Practice from Prions, Viruses, and Systemic Disease | Dentistry Today

Follow us on Instagram

Like us on Facebook

Different Smiles Provoke Different Physical Responses | Dentistry Today

02 Friday Mar 2018

Posted by landisrefining in scrap gold

≈ Leave a comment

smiles
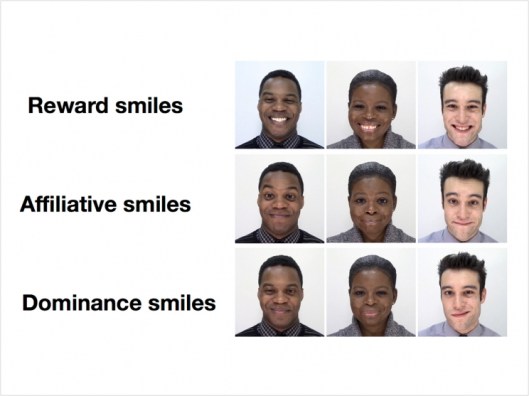
Different kinds of smiles provoke different kinds of biological responses in the people who see them, according the University of Wisconsin-Madison. For example, friendly smiles intended as a reward to reinforce behavior appear to physically buffer recipients against stress. However, smiles meant to convey dominance lead to a spike in stress hormones.

“Facial expressions really do regulate the world. We have that intuition, but there hasn’t been a lot of science behind it,” said Jared Martin, a psychology graduate student and leader of the study. “Our results show that subtle differences in the way you make facial expressions while someone is talking to you can fundamentally change their experience, their body, and the way they feel like you’re evaluating them.”

Previous research by the study’s coauthor, psychology professor Paula Niedenthal, PhD, found three major types of smiles: dominance (meant to convey status), affiliation (communicating a bond showing you’re not a threat), and reward (a toothy smile showing people that they are making your happy).

In the recent study, the researchers stressed out 90 male college students by giving them a series of short, impromptu speaking assignments judged over a webcam by a fellow student who actually was in on the study. Throughout their speeches, the subjects saw brief video clips they believed were their judge’s reactions.

In fact, each video was a prerecorded version of a single type of smile: reward, affiliation, or dominance. Meanwhile, the researchers were monitoring the speakers’ heart rates and periodically taking saliva samples to measure cortisol, a hormone associated with stress.

“If they received dominance smiles, which they would interpret as negative and critical, they felt more stress, and their cortisol went up and stayed up longer after their speech,” said Niedenthal. “If they received reward smiles, they reacted to that as approval, and it kept them from feeling as much stress and producing as much cortisol.”

The effect of affiliative smiles was closer to that of reward smiles: interesting, but hard to interpret, Niedenthal said, because the affiliative message in the judging context was probably hard for the speakers to understand. Also, other research has shown that people with greater variation in the rate at which their hearts beat are better able to understand social cues such as facial expressions.

“People vary in how tolerant or capable they are at sitting with and understanding or engaging with social information,” said Niedenthal. “The thing about your body that permits you to take in the information and process it fully, or make sense of it, is the functioning of your parasympathetic nervous system, which manages your breathing and heart rate and allows you to be calm in the face of social information.”

Subjects with high heart-rate variability showed stronger physiological reactions to the different smiles. But, Martin said, heart-rate variable is not innate and unalterable. Many disorders such as obesity, cardiovascular disease, autism, anxiety, and depression can drag down heart-rate variability. That in turn make people worse at recognizing and reacting to social signals such as dominance and reward smiles.

Read more via Different Smiles Provoke Different Physical Responses | Dentistry Today

← Older posts
Newer posts →

Landis

Landis
Follow Landis Refining Industry News on WordPress.com

No Instagram images were found.

Blogroll

  • Landis Refining Company
  • Live Market Metal Prices
  • Sell dental scrap

Landis Facebook

Landis Facebook

Website Powered by WordPress.com.

  • Subscribe Subscribed
    • Landis Refining Industry News
    • Join 36 other subscribers
    • Already have a WordPress.com account? Log in now.
    • Landis Refining Industry News
    • Subscribe Subscribed
    • Sign up
    • Log in
    • Report this content
    • View site in Reader
    • Manage subscriptions
    • Collapse this bar
 

Loading Comments...